Three Ohio Markets Ranked in Top 10 of the WSJ/Realtor®.com® Winter 2024 Emerging Housing Markets Index
Three Ohio markets rank in the top 10 of the Winter 2024 Emerging Housing Markets Index issued jointly by The Wall Street Journal and Realtor®.com®. Click here to read the Index.
According to information from The Wall St. Journal and Realtor®.com®, “the Index analyzes key housing market data, as well as economic vitality and lifestyle metrics, to surface emerging housing markets that offer a high quality of life and are expected to see future home price appreciation. There were several key takeaways from the index, including the market benefiting from falling mortgage rates, buyers continuing to see limited for-sale inventory and the tension between low buyer demand and even lower seller activity keeping upward pressure on prices.”
The list is as follows:
- Santa Maria-Santa Barbara, CA
- Jefferson City, MO
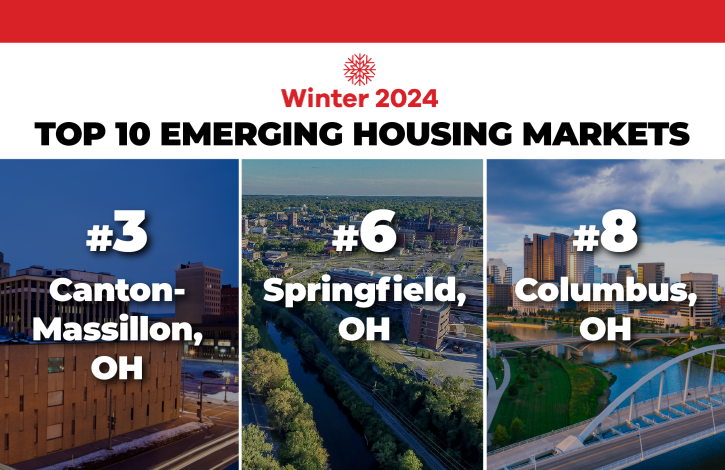
- Canton-Massillon, OH
- Racine, WI
- Oshkosh-Neenah, WI
- Springfield, OH
- Lafayette-West Lafayette, IN
- Columbus, OH
- Johnson City, TN
- Fort Wayne, IN
The analysis highlighted the following key trends shared among markets on the list.
- A tale of two housing markets
- Low-priced locales (still) draw attention
- Demand outpaces inventory: price growth and dwindling for-sale listings
- Amenities keep residents content in mid-sized markets
- Home shoppers are browsing out-of-market
According to the jointly issued report, the index methodology looks at:
The ranking evaluates the 300 most populous core-based statistical areas, as measured by the U.S. Census Bureau, and defined by March 2020 delineation standards for eight indicators across two broad categories: real estate market (50%) and economic health and quality of life (50%). Each market is ranked on a scale of 0 to 100 according to the category indicators, and the overall index is based on the weighted sum of these rankings. The real estate market category indicators are: real estate demand (16.6%), based on average pageviews per property; real estate supply (16.6%), based on median days on market for real estate listings, median listing price trend (16.6%). The economic and quality of life category indicators are: unemployment (6.25%); wages (6.251%); regional price parities (6.25%); the share of foreign born (6.25%); small businesses (6.25%); amenities (6.25%), measured as the average number of stores per specific “everyday splurge” category (coffee, upscale/specialty grocery, home improvement, fitness) per capita in an area; commute (6.25%); and estimated effective real estate taxes (6.25%).